
GUI for TI DLP NIRscan Nano EVM
GUI for TI DLP NIRscan Nano EVM
This is a GUI for the Texas instruments DLP NIRscan Nano EVM (EValuation Module; DLP2010NIR). It features:
- Visualisation of spectra
- Analysis of different spectra by difference view
- Cluster view
- Automatic identification of material based on reference data
- Documentation via HTML report forms and
This GUI focuses on a straight forward easy to use interface and is perfect for all who want to focus on evaluating the precision of the DLP module rather than programming.
The software outputs NIR spectra data via an open JDX data format. A 14 day demo licence is available!
DLP evaluation module software – Main features
Visualisation of NIR spectra
The GUI features a simple and straight forward visualisation of all NIR spectra in the range of 900 nm to 1700 nm.
You can choose between absorption and intensity.
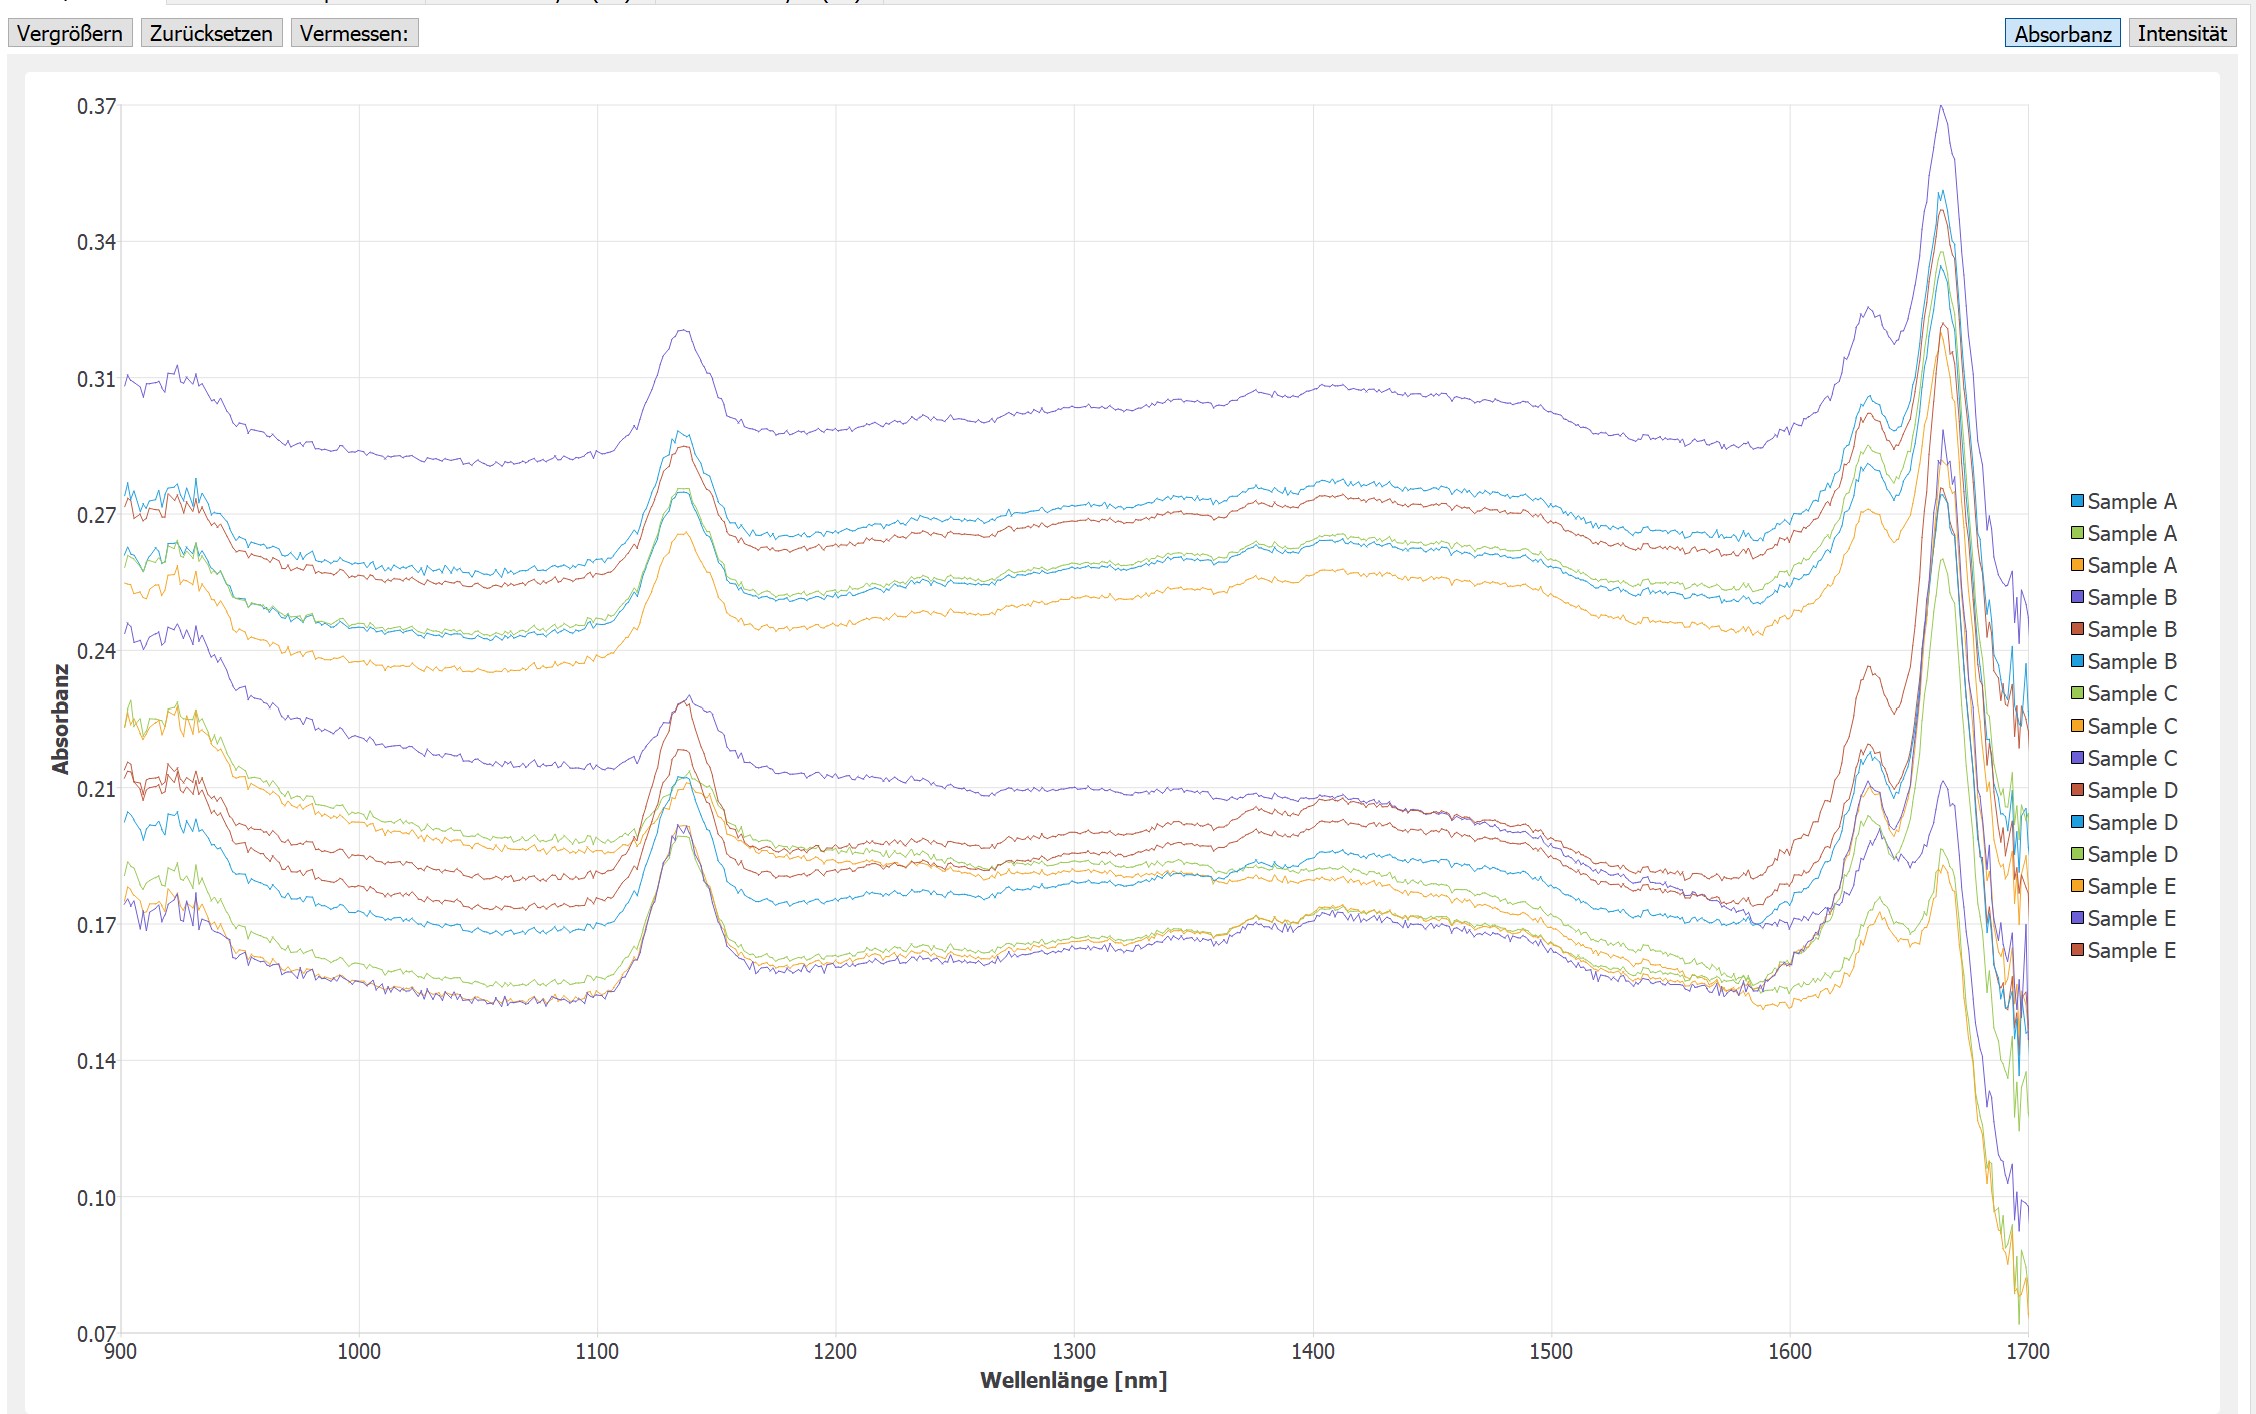
Visualisation of NIR spectra generated by TI DLP NIRscan Nano EVM.
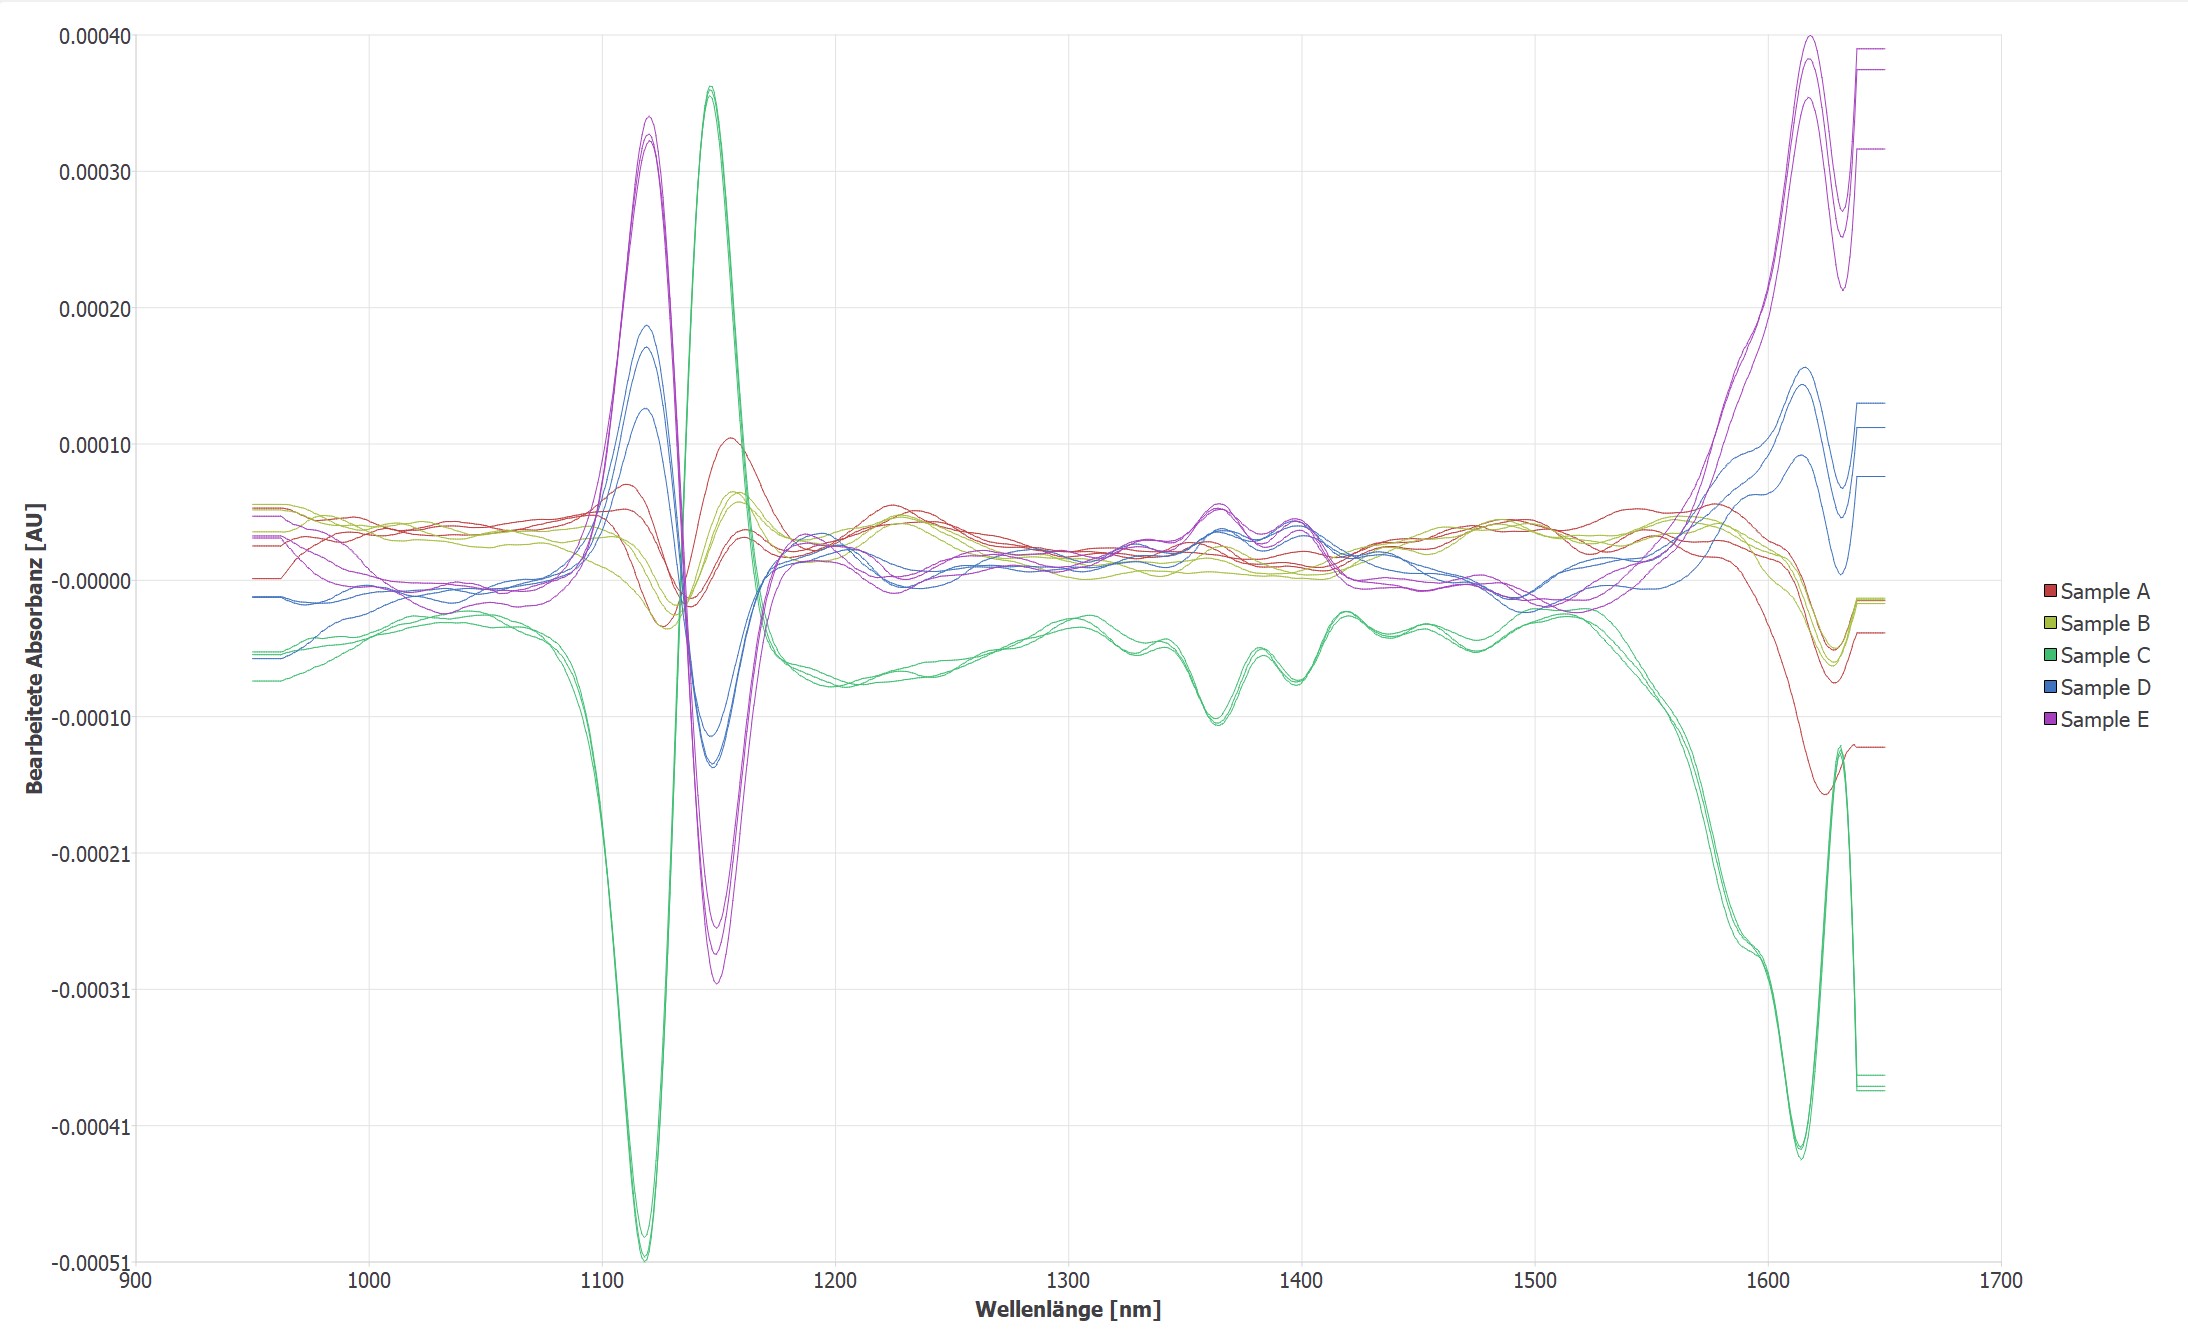
View shows differences in NIR spectra at specific wavelength.
Visualisation of differences in NIR spectra
This view allows you to identify differences in the spectra easily. The view enables zooming and measurement of precise wavelength.
Visualisation of similar data sets via cluster analysis
You do have a huge amount of NIR spectra and need to know if there are spectra that are quite similar? Use the cluster analysis to find out.
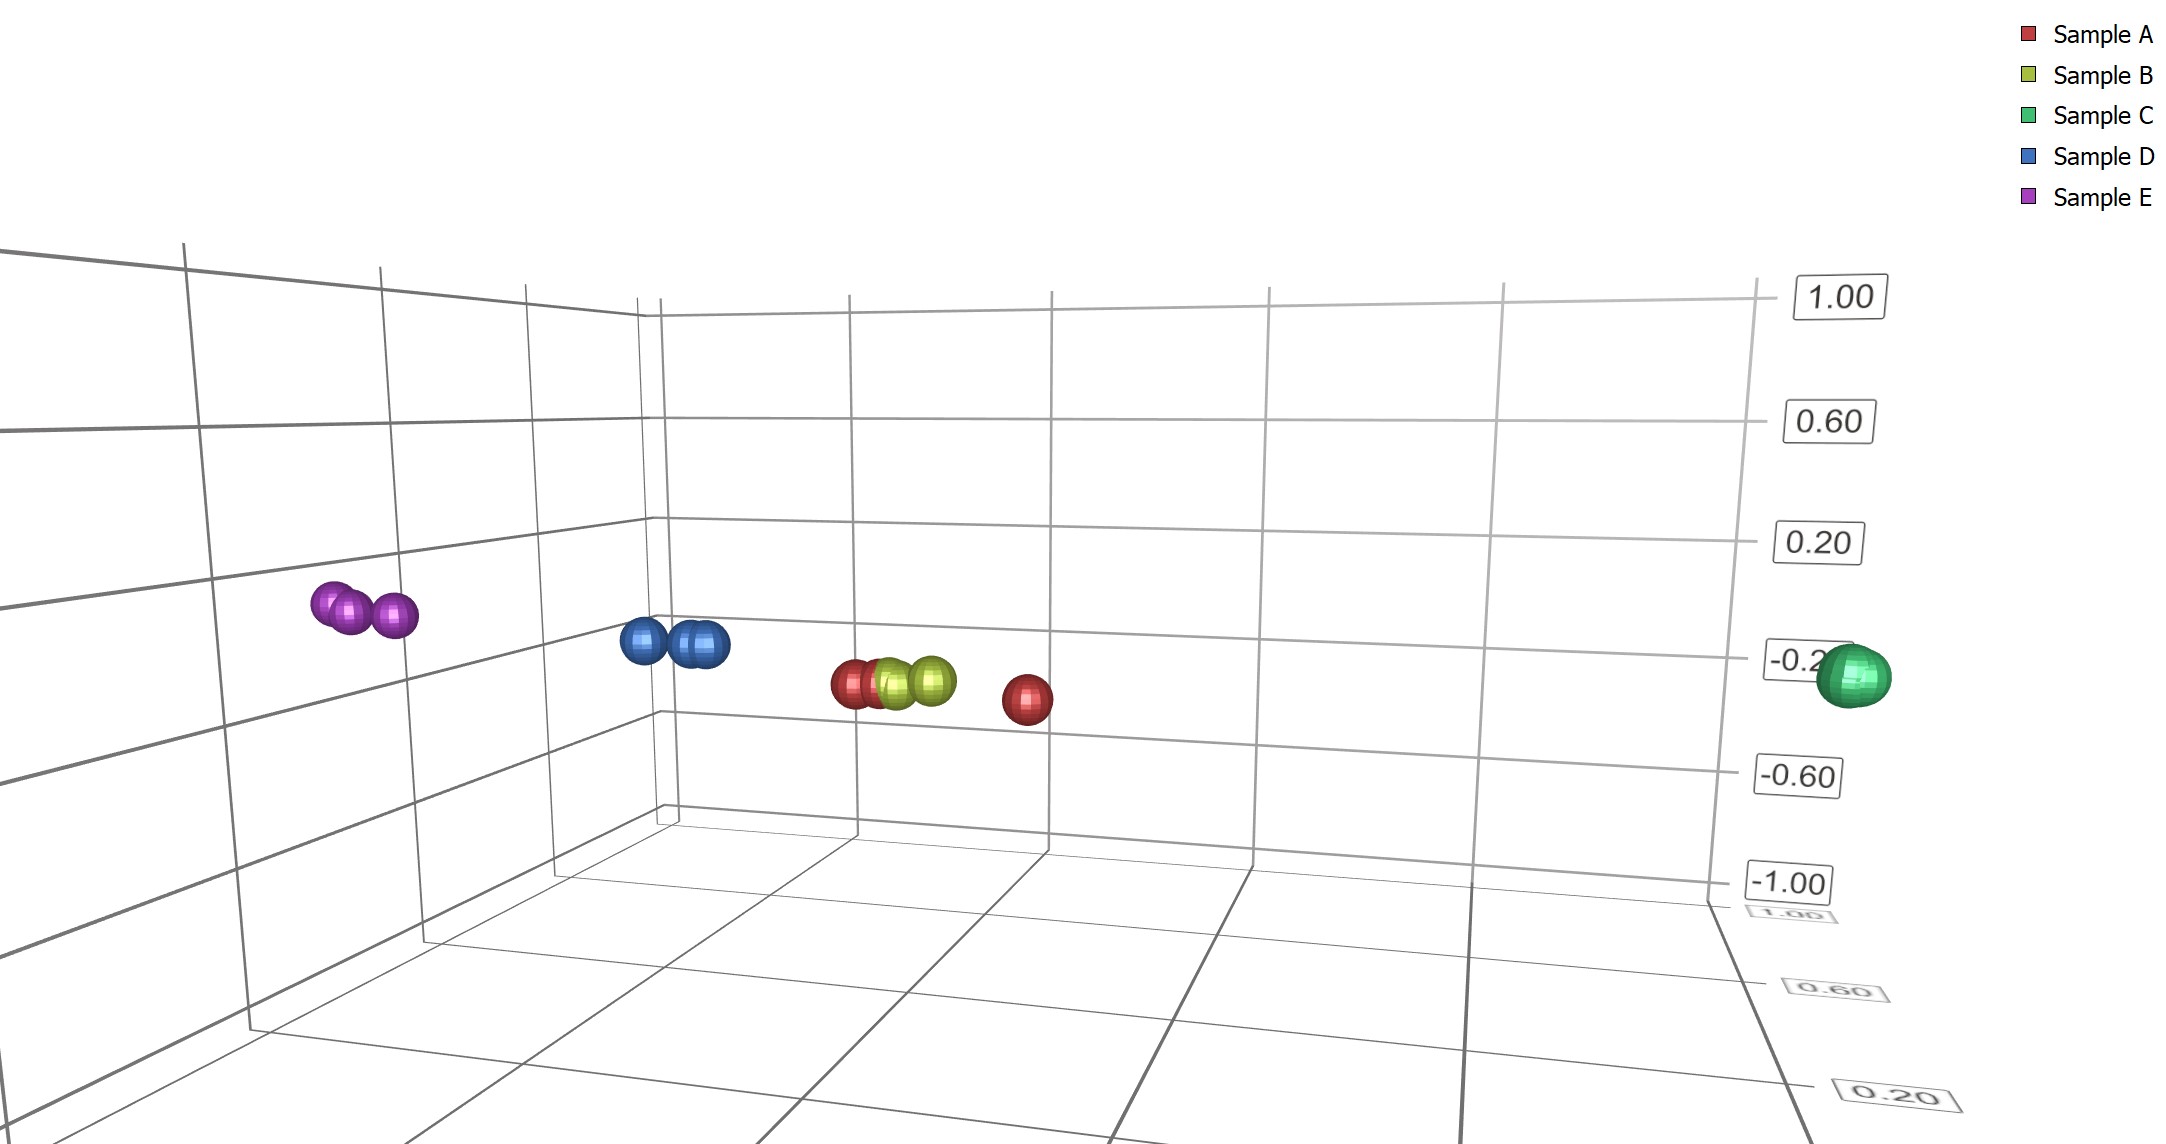
View shows result of cluster analysis. Perfect for analysis of huge amount of data.
Identification of new material based on known reference data
Once you have generated your own reference data the automated identification of your samples is child’s play: Upload your data base, activate the identification and identify new samples within seconds.
Did you know? We provide several comprehensive reference data bases for plastics?
DLP evaluation module software – More features
- Dark current – Set dark current for compensation of noise from your own set up. Enables you to compare signals from different setups and eliminates changes of signal due to changes in setup over time.
- Own reference data – Set your own reference data to be subtracted from you signal. E.g. you teach in the material of the bag which contains the material you are interested in. This reference data will be subtracted from the main signal (= bag + sample material) to get the “plain” signal of your sample material.
- Reporting – Generate reports of your measurements based on HTML forms. It outputs a PDF file.
- Open JDX format – The GUI outputs open JDX data, which can be opened, manipulated by any text editor. Use the data easily with different software solutions.
Get your 14 day demo licence now!
(*) Mandatory fields.
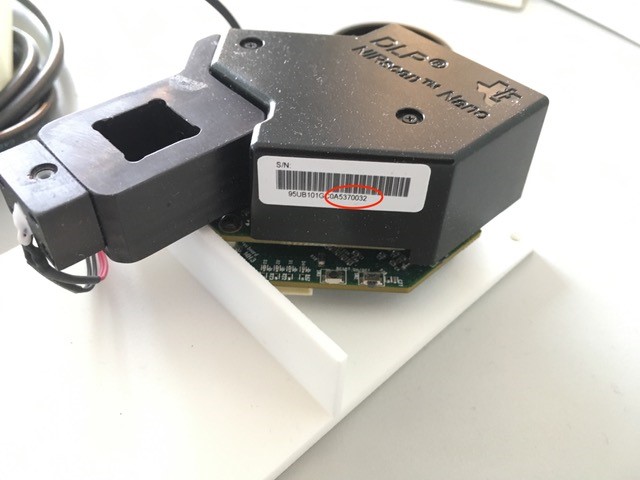
Where to find your serial number.